

Key takeaways
- Canada faces two generational challenges: a housing affordability crisis and underperforming competitiveness/productivity relative to its peers.
- Because these problems were left to fester, solving both will require investment on a staggering scale, raising crucial questions: where will the money come from and what will be the broader economic consequences?
- CMHC estimated that 4.8 million new housing units will be required over the next 10 years to restore affordability; PBO pegs the need at 3.8 million new units to close the housing gap and prevent further deterioration.
- Assuming a relatively low cost per unit of between $500,000 and $750,000, including building materials, labour, development charges, supporting infrastructure, etc., building 4.8 million units would cost $2.4tr to $3.6tr; preventing further deterioration would cost $1.6tr to 2.5tr.
- Accounting for units that would have been built anyway, the extra investment required would be $1.2tr to $1.7tr; about a third less if we merely close the housing gap. Putting this number in perspective, investment in new residential units would need to double over the next 10 years to restore affordability.
- Canada's dismal competitiveness and productivity record stems from decades of underinvestment, resulting in a stock of capital per worker that is 40% below the median of the OECD's most productive countries plus Australia.
- Closing half of that gap over the next 10 years would require capital stock per worker growth of 3.2% to 3.5% annually, compared to an average growth of 1.1% since 2000, equivalent to $4.0 to $4.5tr investment over the next 10 years, or $2.9tr to $3.7tr in addition to what could be expected over the period.
- The bare minimum to prevent further widening of the stock of capital per worker relative to its peers would require $1.8tr to $22tr over the next 10 years, or $0.8tr to $1.8tr in additional investment.
- Put together, the investment needs to restore affordability and competitiveness are staggering: $6.4tr to $8.1tr in investment over the next 10 years or $4.1tr to $5.4tr on top of the status quo. This is the equivalent of increasing the share of investment in GDP by about 18 to 23 percentage points. To prevent further worsening of the situation would require $1.5tr to $2.3tr in additional investment, equivalent to 5 to 9 percentage points of GDP.
- Such large sums raise important questions: Where will these trillions of dollars come from, and how will they be financed?
- For one sector to borrow and invest, another sector needs to save and lend the necessary funds. In other words, the availability of funds in an economy is limited and scarce. This means that all types of investments compete for access to scarce savings, so savings flow to higher risk-adjusted returns.
- Corporations and government are both likely to remain net borrowers, as they will be the ones investing, leaving non-residents and households as the two sectors that must supply the savings.
- Households have been net borrowers since the late 1990s and have been partly responsible for crowding out business investment since. They would need to shift toward net saving, a likely difficult and unpopular adjustment given ongoing affordability pressures and the belt-tightening required.
- Foreign investors, already significant net lenders, are the only sector able to meaningfully increase the savings flowing towards Canadian investment, and Canada cannot reach its ambitious goals of restoring housing affordability and its productivity without significant foreign investment.
- However, further reliance on foreign investors and ownership raises the risk that Canada becomes an "extractive" economy, where profits are repatriated abroad rather than reinvested in the Canadian economy, limiting the investment's positive spillovers to the rest of the economy and potentially giving foreign investors more influence over policy decisions.
- Attracting the large amount of capital required will likely necessitate higher interest rates or returns, whether to incentivize domestic savings or to attract foreign capital. However, higher interest rates risk making some needed investments uneconomical, creating a self-limiting dynamic.
- Containing this dynamic will require deliberate policies to increase the domestic supply of capital by promoting domestic saving. Similarly, actions will also be needed to ensure that national savings are directed towards domestic investment rather than abroad.
- There is no easy path out of Canada's predicament. Improving housing affordability and competitiveness/productivity can be within reach, but only with a scale of investment, saving, and structural adjustment that the country has not mustered in decades. Falling short means accepting Canada will continue to lag further behind its peers.
The country is facing two generational economic challenges at once: a housing affordability crisis that has left home ownership out of reach for many, especially young Canadians, and a competitiveness problem that has left Canada's productivity and living standards trailing most of our OECD peers. Neither of these issues is new and has been left to fester for too many years. Fixing either of them will require significant investment. What has been less clear is just how large the price tag is.
It is important to note this is not a matter of a few billion dollars here and there. Restoring housing affordability and closing the competitiveness gap with the world's most productive economies would require investment measured in the trillions of dollars over the next decade, significantly more than what is likely to happen under the status quo.
This raises three crucial questions. First, how much investment will be required to meaningfully move the needle on housing affordability and productivity? Second, where is that money going to come from? And third, what are the broader economic consequences of trying to raise that kind of capital?
The answers are sobering. Canada's ambitions are achievable, but it will require significant adjustments and sacrifices, and it is unclear whether businesses, households and governments are ready to make them.
There is an important link between affordability and productivity. Canada's lack of affordability is as much a problem of weak income growth, due to decades of productivity underperformance, then an issue of high prices. As such, disposable income per person adjusted for inflation, a measure of purchasing power, has been growing 1 percentage point slower per year since 2015 (the year of the oil bust) than on average between 1996 and 2014 (see The Lost Decade(s): or how the oil boom masked Canada's economic mediocrity). Putting this in perspective, the past 10 years of underperformance means that the purchasing power of the average Canadian is about 10% lower than where it would have been otherwise. The longer the situation persists, the further behind Canadians will end up being.
Restoring housing affordability
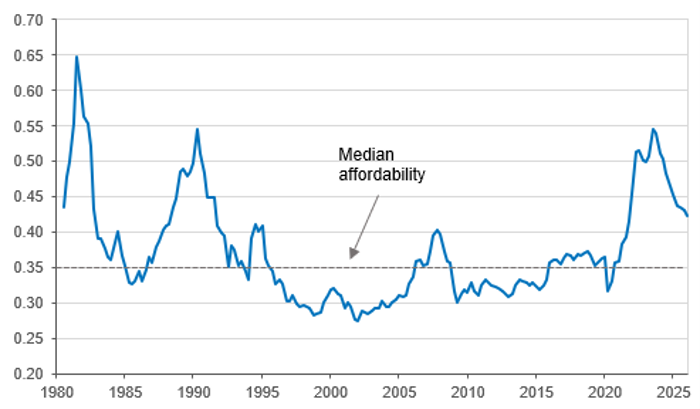
Housing affordability has been a major issue in Canada in recent years. It is the result of more than a decade of house prices rising faster than income due to persistently low interest rates, weak supply of new homes and strong population growth.
There are only two ways to restore housing affordability, and both adjustments impose different costs on households. 1) Price declines are the fastest way to improve affordability but at a cost for current homeowners who see the value of their asset decline. 2) Higher income is the most durable way to improve affordability. However, it is a process that will take time, leaving housing unaffordable in the medium term, unless income growth accelerates meaningfully. However, if a lack of supply is the reason for the unaffordability, then either adjustment may only be temporary, as lower prices or higher income will stimulate demand, pushing prices to unaffordable levels again.
Hence, the consensus is that a significant increase in housing supply will be needed to restore affordability. There is, however, a relatively wide range of estimates as to how many new housing units will be required to achieve this goal.
CMHC estimated in 2005 that about 4.8 million new units would be required. This is based on an objective that "the adjusted housing price metric should be no higher than 30% of gross household income where this is still realistic, or no higher than its 2019 level in the most expensive regions". This estimate also includes the units that would have been built anyway, about 2.45 million units. If we only consider new supply, it is 2.35 million units.
Similarly, in the Budget 2025, the federal government is aiming for 5 million new units; their estimate is likely based on CMHC's.
On its side, the PBO estimates that 3.2 million units will be required to close the housing gap. However, the PBO estimate should be considered the bare minimum to avoid further deterioration in affordability, as it does not explicitly have an affordability objective in the hypothesis supporting its estimates.
Fig 1. Bank of Canada's housing affordability index
Source: Bank of Canada
How much will it cost to build all these homes?
Based on estimates from Altus Group, housing units in Canada are estimated to cost between $210,000 and $350,000 per unit for a typical purpose rental unit or high-rise condos, up to between $370,000 and $600,000 for a typical single-family home.
These estimates do not account for development charges and the cost of infrastructure (water pipes, sewers, electricity grid, roads, sidewalks, etc.). Finding a credible estimate of the all-in cost of building a housing unit is not an easy task, especially since it varies greatly across municipalities, regions, and types of housing units. Nevertheless, estimates range from $400,000 to more than $1,5 million per unit.
Assuming each housing unit costs $500,000 to $750,000, including all costs included, building the 4.8 million housing units required to restore affordability will cost between $2.4tr and $3.6tr over the next 10 years. If we assume that the aim is only to close the housing gap and not improve affordability, it will cost between $1.6 trillion and $2.4 trillion to build the 3.2 million units the PBO estimated would be needed.
Obviously, many of these housing units would be built anyway. Using the CMHC's assumption that about 250k units would have been built every year anyway over the next 10 years, it means that 2.35 million extra units need to be built for an extra cost of between $1.2tr and $1.7tr to restore affordability. Without restoring affordability and only closing the housing gap, the extra investment required is between $350mn and $525mn for the extra 700,000 units that would need to be built.
These estimates show the size of the investment required over the next 10 years to restore affordability: between $1.2tr and $1.7tr in excess of the status quo. Even to ensure that housing affordability does not deteriorate further, it would require significant extra investment
While our estimate of the cost of delivering new housing units is far from precise, it provides a ballpark of the size of the investment in new housing supply that will be required over the next decade.
To put it into context, the value of residential investment in new construction in 2025 was about $116bn, or 1.2tr if sustained for 10 years. Hence, to restore affordability would require doubling that amount.
With this point in mind, a crucial question is whether we can lower the cost of building each unit. Reduced development charges, factory-built houses, new technology, etc., could reduce costs and the required investment in new housing units and will be necessary.
Fig 2. Housing investment needed

Source: Servus Credit Union
Restoring productivity and competitiveness
Canada's productivity and competitiveness have significantly underperformed those of most OECD countries over the past few decades. The main culprit for this underperformance has been the lack of investment in the economy.
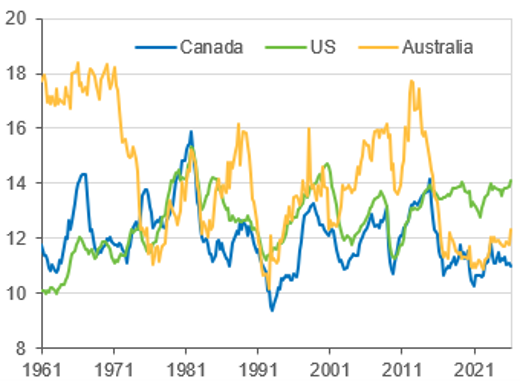
As we have shown (see Canada's housing obsession is cannibalizing productivity), while the share of private investment in GDP has been generally similar to that observed in the US, its composition is dramatically different. As such, Canada's non-residential investment has been significantly weaker since the 1980s, with most of the difference attributable to weaker investment in machinery, equipment, and intellectual property. On the flip side, Canada's residential investment, which does not increase the stock of productive capital, as a share of GDP, has been significantly above the US since the early 2000s.
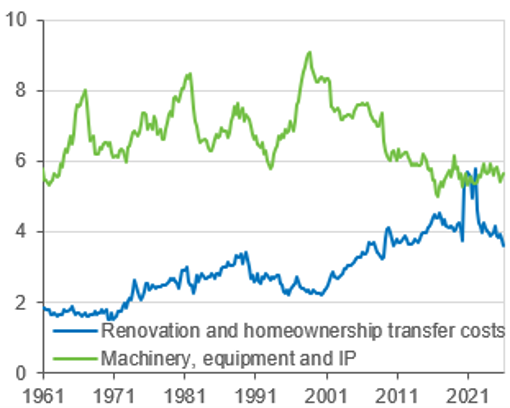
The contrast between residential and non-residential investment in Canada is staggering. As such, in 2022, the share of GDP being spent on investment on machinery, equipment and IP (productive investment) was almost the same as the share of GDP spent on home renovation and homeownership transfer costs.
As a result, Canada's stock of capital per available worker has increased more slowly than in most other OECD countries, especially relative to countries currently ranked at the top in terms of productivity.
Canada's lagging productivity and income per person. Improved productivity leads to higher income, which could also help with housing affordability
Fig 3. Private non-residential investment (% of GDP)
Source: Statistics Canada, BEA, ABS, Servus Credit Union
Fig 4. Investment in machinery, equipment and IP vs home renovation and homeownership transfer costs (% of GDP)
Source: Statistics Canada, Servus Credit Union
Stock of capital, productivity and GDP per capita
In this report, we follow the C.D. Howe Institute methodology of using the stock of productive capital per available worker[1], as defined by the stock of productive capital divided by the size of the labour force. This prevents the measure from being subject to variation due to cyclical changes in the labour force, like layoffs during recessions. The stock of productive capital measures the capital that contributes to market production. It includes infrastructure, machinery and equipment, intellectual property, research and development, but excludes residential capital. All the measures are then expressed in Canadian dollars using the OECD's PPP (Purchasing Power Parities) measure.
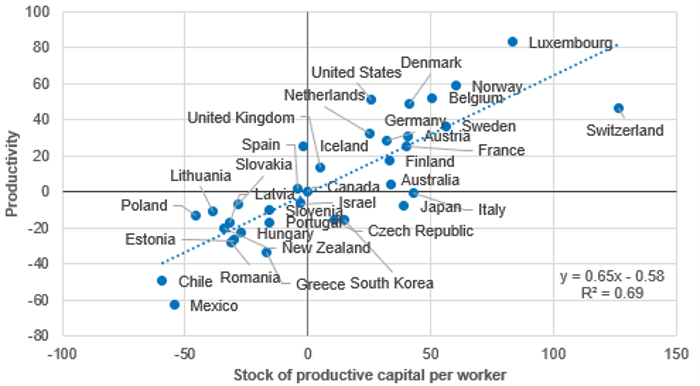
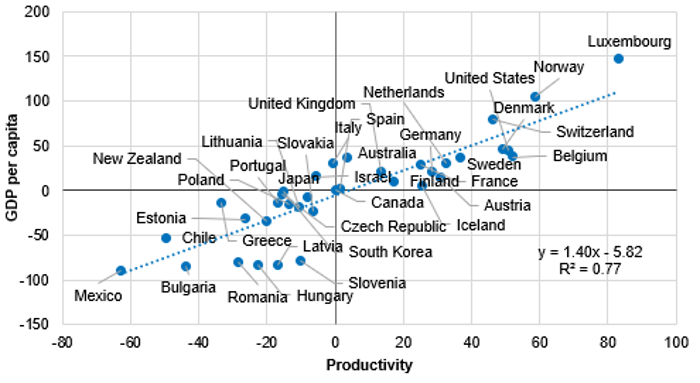
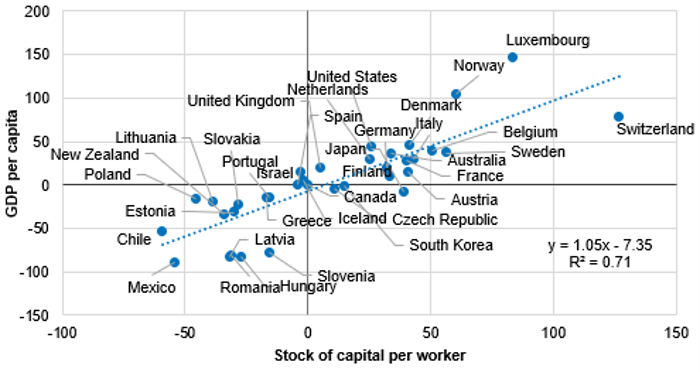
There is a strong correlation between the stock of productive capital per worker and productivity levels across OECD countries. Unsurprisingly, a higher level of productive capital per worker translates into higher productivity (see Fig 5). Similarly, a higher stock of capital translates into a higher GDP per capita (see charts in Appendix).
Fig 5. Stock of productive capital per worker vs productivity (% deviation relative to Canada)
Source: OECD, Servus Credit Union
Hence, improving Canada's productivity, competitiveness and standard of living will be directly linked to whether the country can significantly increase its stock of capital per worker and, more importantly, narrow the gap with leaders in the OECD.
Our comparison point will be a sample composed of the top performers in terms of productivity in the OECD, namely Luxembourg, Norway, Belgium, US, Denmark, Switzerland, Sweden, the Netherlands, Austria, Germany, and France. We also add Australia, which has an economic structure similar to Canada's: a small open economy with a large resource sector, but higher capital per worker and slightly better productivity performance.
Looking at these countries, we find that:
- The stock of capital per worker of these countries is 50% higher than in Canada on average, 41% if using the median, ranging from 28% higher in the case of the Netherlands to 118% for Switzerland.
- Back in 1995, the average stock of capital per worker of this group of countries was 30% above that of Canada.
- The stock of capital per worker increased 1.6% per year on average for these countries since 1995, while it has been more modest at 1.2% in Canada.
- More importantly, since the oil bust of 2015, Canada's stock of capital per worker has increased a modest 0.2% per year on average, compared to 1.2% for the other countries. Since 2000, the pace has been 1.1% per year in Canada and 1.6% in the other countries.
- As expected, given the link with the stock of capital per worker, these countries have a productivity level 37% higher than Canada's, and their GDP per capita is 31% higher on average.
Based on these observations, Canada needs to significantly increase its capital per worker to bring its productivity more in line with those of these countries.
How much investment will be required?
What is clear is that it will require a prolonged period during which Canada's capital stock per worker grows faster than its OECD peers to close the gap. The question is: how much investment, in dollar terms, would be required to restore Canada's competitiveness? And is it feasible?
The answers will depend on the objective. We consider three objectives for the stock of capital per person over 10 years, from most to least ambitious.
- Fully catching up with this group by reaching the median level of stock of capital per worker
- Narrowing the gap by half in terms of stock of capital per worker relative to the median stock of capital per worker of the group. In other words, for Canada's stock of capital per worker to be about 20% below that of the leaders in 10 years.
- Keeping the gap with the median stock of capital per worker of these countries constant, currently 41% below.
The last objective should be considered the bare minimum Canada should aim for, as it simply means the country is no longer losing ground relative to the most productive OECD countries.
Fig 6. Average yearly change in the stock of capital per worker (%)
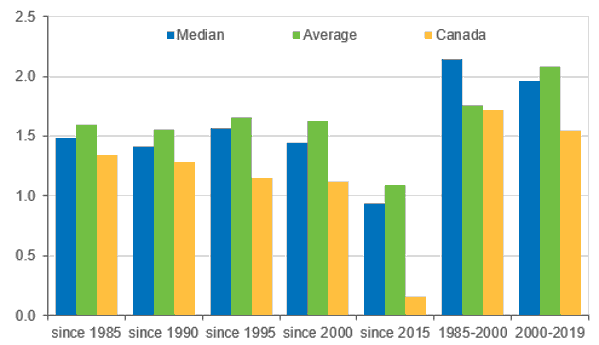
Note: the median and average growth over the periods for Australia, Austria, Belgium, Denmark, France, Germany, Luxembourg, Netherlands, Norway, Sweden, Switzerland, and US. Source: OECD, Servus Credit Union
To estimate the investment needed, we build various scenarios based on the historical pace of capital accumulation per worker, looking at two different scenarios in terms of expected annual change: 1) average since 2000, with a pace of capital accumulation in Canada was about 0.5 percentage points (pp) below that of the other countries and 2) average since 2015, when the pace about 0.9pp lower over the period.
Our approach is to calculate, for all countries in the sample, the stock of capital per worker 10 years from now, using their respective growth rates over the two periods. From there, we estimate the change in Canada's stock of capital per worker required to meet the objective set above.
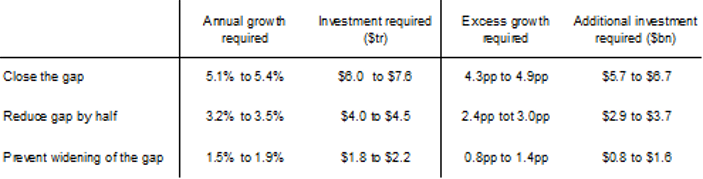
- To reach the median level, Canada's stock of capital needs to grow between 5.1% and 5.4% per year
- To narrow the gap by half would require a growth rate between 3.2% and 3.5% per year.
- To keep the gap unchanged would require a growth rate of 1.5% and 1.9%.
It is important to keep in mind when evaluating these numbers that Canada's performance has been significantly lower than these estimates on average over the past 40 years (see Fig 3).
With these observations, it is also important to consider what growth rate would be required in excess of what would likely have been accomplished anyway, assuming Canada's stock of capital grows at its historical pace, i.e., since 2000 and since 2015. In this case, the excess pace of capital accumulation is as follows:
- Between 4.3 and 4.9 percentage points of extra growth per year
- Between 2.4 and 3.0 percentage points of extra growth per year
- Between 0.8 and 1.4 percentage points of extra growth per year
Without an increase in the pace of capital accumulation, the gap between Canada's stock of capital per worker and its OECD peers will widen, reaching between 51% and 62% below the median level in 10 years.
Let's put these growth numbers in terms of the value of investment required to reach that goal. We estimate that there will be 28.2 million available workers in Canada in 2035, using Statistics Canada's population projection and assuming that the current participation rate across age cohorts remains constant over the period.
This means that the aggregate amount of investment required in each scenario is as follows:
- In Scenario 1, it would require between $6.9tr and $7.6tr in investment over the period, between $5.7tr and $6.7bn extra
- In Scenario 2, it would require between $4.0tr and $4.5tr in investment over the period, between $2.9tr and $3.7bn extra
- In Scenario 3, it would require between $1.8tr and $2.2tr in investment over the period, between $0.8tr and $1.6bn extra
It is clear from these numbers that if Canada's objective is catching up with the countries identified as top performers in terms of productivity, it will be extremely difficult to attain. Even a more modest objective, such as reducing the gap with these countries by half or even not falling further behind the group, will require a significant boost in business investment.
Fig 7. Investment in stock of capital per worker required
Source: Servus Credit Union
An important caveat to these numbers is that they are based on the net increase in capital per worker required. Hence, they do not take into account the investment required to maintain the stock of capital and reverse normal depreciation. For reference, the OECD assumes a 4.72% depreciation rate per year in its models, while the Bank of Canada's models use 6%.
If we assume 5% depreciation per year for our estimates, the total amount of net investment in excess required to maintain the capital jumps, reaching the following levels:
- Scenario 1 requires between $15.6tr and $17.1tr of capital in excess of what would have been the case.
- Scenario 2 requires between $11.3tr and $12.6tr
- Scenario 3 requires between $9.5tr and $10.2tr
Putting these numbers in context, the economy requires about $1 trillion in investment per year, the equivalent of about 30% of GDP, over the next 10 years just to ensure we do not see further decline in competitiveness relative to the leaders in the OECD.
Canada's ambition will cost between $4tr and $5.4tr in additional investment
Putting these estimates together, restoring housing affordability will require between $2.4tr and $3.6tr in investment to supply the almost 4.8 million homes required, while reducing the gap between Canada's stock of capital and top 10 productivity performers in the OECD by half, not the most ambitious goal, will require between $4.0tr and $5.2tr, excluding depreciation. For a total of $6.4tr and $8.8tr in required investment.
However, as mentioned before, many of these investments would have happened anyway. So, if we consider only the investment required in excess of what is already likely to be spent, restoring affordability will require between $1.2 and $1.7tr in additional investment, while restoring the stock of capital will require between $2.9tr and $3.7tr. This brings the total amount of additional investment to between $4.1tr and $5.4tr over the next 10 years.
If we lower our ambition and aim to only close the housing gap without restoring affordability, it will require $3.2tr and $4.6tr in investment, excluding depreciation. This would mean between $1.1tr and $2.1tr of investment in addition to what would likely have been spent over the period.
It is important to note that the latter estimate should be considered the bare minimum that needs to be invested over the next 10 years just to prevent further deterioration in Canada's economic situation.
Fig 8. Total investment required for affordability and competitiveness

Source: Servus Credit Union
How does that compare relative to the economy?
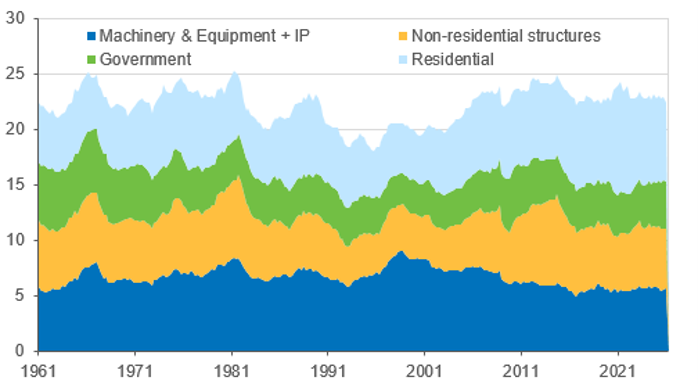
Canada's nominal GDP stand at about $3.2tr currently. Investment, including residential, non-residential and government, has represented about 23% of GDP on average over the past decade.
To restore affordability and improve its competitiveness would require between $410bn and $540bn in additional investment every year for the next 10 years, representing an additional 18pp to 23pp of GDP in additional investment, meaning that the share of GDP going to investment will need to increase to between 41% and 46% of GDP, if other GDP components remain constant.
Preventing further deterioration in housing affordability and productivity would require additional investment of between $110bn and $210bn per year. This is equivalent to 5pp and 9pp of GDP, meaning that investment as a share of GDP would need to reach between 28% and 32%, if other GDP components remain constant.
It will remain challenging to reach those shares of investment in economic activity, considering that investment has never sustainably been more than 25% of the Canadian economy since 1960. As we have shown (see housing cannibalizing productivity), there is competition between the various parts of investment. As a result, some components may need to see their share diminish to make room for growth in new residential construction, machinery, equipment and IP, and non-residential structures at the expense of home renovation and homeownership transfer costs.
Fig 9. Investment - details (% of GDP)
Source: Statistics Canada, Servus Credit Union
Money doesn't grow on trees, so where will it come from?
The other challenge will be where the trillion dollars required to finance the investment will come from.
In a closed economy, i.e. if there is no access to global capital markets, the amount of investment in the economy will be equal to the amount of savings. This implies that for someone in the economy to invest, someone else needs to save.
Allowing for foreign capital, we have the following identity:
Current account = saving – investment
Investment = domestic saving + foreign saving
This identity states that if a country's investment exceeds its national savings, the difference must be borrowed from non-residents. Hence, there is a current account deficit. Conversely, if investment is below national savings, the extra money is lent to non-residents, leading to a current account surplus.
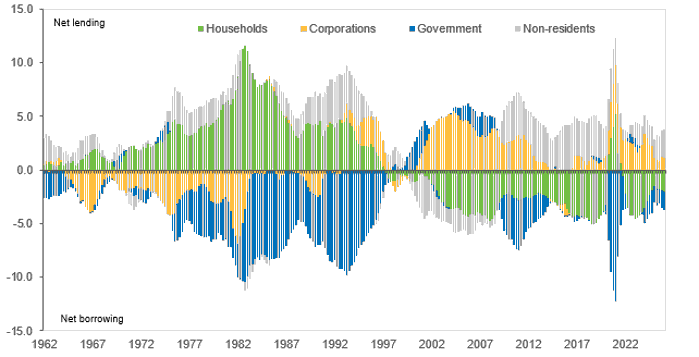
The financial flow data in the national accounts allows the decomposition of national savings and national investment by sectors of the domestic economy. As such, each sector, namely households, corporations, government and non-residents, can be either a net lender (saver) or a net borrower (investor) in the economy (Fig 4).
This distinction is essential. For one sector to borrow and invest, another sector needs to save and lend the necessary funds. In other words, the availability of funds in an economy is limited and scarce. Even if a sector wants to invest, investment will suffer if other sectors are unwilling or unable to save and lend funds.
It is crucial to understand this because it means that all types of investments, residential, infrastructure, defence, machinery, equipment and IP, research and development, etc., are all in competition against each other to have access to the scarce savings available. This competition also means that the savings will flow to finance investments with higher risk-adjusted returns.
As we have shown (see Canada's housing obsession is cannibalizing productivity), there is evidence that this competition has led residential investment, via household borrowing, to crowd out productive investments in machinery, equipment, and intellectual property over the past 25 years.
Looking at the state of Canada's financial flows, an important question comes to mind: who will be the net lender for the vast sum of investment that will be required over the next 10 years?
Fig 10. Net borrowing and net lending as % GDP (4Q sum)
Source: Statistics Canada, Servus Credit Union
Corporate sector
The needed spending on investment will be done by the corporate sector. Hence, they will need to be net borrowers to boost investment, whether to build the housing units required or to increase the stock of capital per worker. Therefore, they will be unable to be net lenders. There may be some difference between non-financial and financial corporations, where the non-financial sector will be a significant net borrower, while financial corporations are likely to be net lenders, as they tend to be net savers.
Government sector
The government will be very unlikely to be in a position to save or, in other words, run fiscal surpluses. It will invest in defence, infrastructure projects, and other priorities. Moreover, they will very likely need to forgo some tax revenues or increase spending to provide incentives for businesses to invest. This could take the form of accelerated depreciation allowances, tax credits, subsidies, or other measures.
This leaves two sectors that will need to step up to provide the pool of savings required: non-residents and households.
Non-resident sector
Non-residents are already significant net lenders to the Canadian economy. Since the Global Financial Crisis, they have been a significant source of net lending, averaging about 4% of GDP over the period, even when including the weak inflows seen during the post-COVID recovery. The non-resident net lending has improved over the past year and represented about 2.6% of GDP at the start of 2026.
The question is whether they will be willing to increase their investments in Canada. They will not lend to Canada solely because we are not the US. They will require competitive risk-adjusted returns. Canada will compete with the rest of the world to access the pool of global savings. Attracting foreign capital will require returns but also greater certainty regarding the project's completion and reduced risks.
Household sector
The household sector has been a significant net borrower since 1997, absorbing, on average, the equivalent of 2.5% of GDP per year, with periods as high as 4.5% of GDP in the late 2010s. As we have shown (see Canada's housing obsession is cannibalizing productivity), this was a period where household indebtedness was on the rise, and residential investment in Canada, especially renovation and homeownership transfer costs, was increasing as a share of GDP. In our view, significant household borrowing was responsible for the weakness in productive investment over the period by crowding out business investment.
It will be crucial for the household sector to reduce its net borrowing. This will reduce the reliance on the non-resident sector as a provider of net lending for Canada's borrowing needs. The absence of a reduction in household net borrowing will mean that the government, household, and corporate sectors will compete against each other for the pool of non-resident net lending. Hence, it is very likely that 1) not enough foreign capital could come into the country to finance all the investment needs, leaving sectors underfunded. 2) the bigger the size of the flow needed to be attracted is, the higher the borrowing cost or the return asked for by foreign investors will be. As a result, some projects may become non-economically viable due to higher borrowing costs, reducing the amount of investment ultimately undertaken and raising the spectre that Canada's economic issues will not be addressed.
Changes in financial regulations could play a role here. As we have identified previously (see housing vs productivity), reforming the current set of financial regulations to promote lending to businesses and reducing regulations that favour lending to households at the detriment of other sectors will be necessary.
Ideally, the household sector should return to being a net lender. This would mean repaying its current high level of debt and increasing its saving rate. However, this will be a challenge. Households continue to face affordability pressures, with many unable to save, and high house prices mean they will need to continue to take out significant mortgages to own a property.
Ultimately, the household sector returning to being a net lender will require significant adjustments and sacrifices, including some serious belt-tightening. It is unclear whether the sector is ready for such actions, and whether it understands the imperative of the challenge that may be required.
Risks of excessive foreign ownership
What is clear is that Canada cannot reach its ambitious goals of restoring housing affordability and improving its productivity without significant foreign investment into its economy. There is simply not enough domestic saving to satisfy the country's investment needs, even with some serious belt-tightening from the household sector.
As a result, foreign investment will be critical for Canada to reach its ambitious investment goals. However, it may come at a long-term cost. As we see in the Canadian oil and gas industry, a high level of foreign ownership means that once an investment project becomes profitable and profits are returned to investors, a significant share of the benefits leaves the country and is not reinvested in the local economy.
This could have some long-term implications for the Canadian economy.
- Could Canada become an extractive economy, where economic activity is high, but where the local economy does not benefit fully from its improvement in productivity and GDP per capita? Dividend flows to local investors have a larger economic multiplier because they are more likely to spend or reinvest them in the domestic economy, whereas foreign investors are more likely to repatriate these revenues to their home countries.
- With a smaller proportion of the economic benefits being reinvested in the economy, it raises the question as to whether, after the initial investment boost, the flow of investment will remain strong enough to cover the depreciation of the capital in place and to keep the stock of capital per worker growing at a pace that keeps Canada's competitiveness. Otherwise, Canada could find itself in the same situation as it is currently in decades from now, where it requires significant investment to improve its competitiveness.
- Could significant foreign investment make the local economy more sensitive to the whim of foreign investors? Could it force governments to take decisions in favour of foreign investors rather than locals to avoid a flight of capital or a drying out of foreign investment in the economy?
We will need to take these risks seriously. While the situation would still be better than it would be without the foreign participation in the first place, we will need to think hard about how to ensure that foreign investors have an incentive to reinvest their profits back into the Canadian economy so that the benefits of the investment flow back into the economy and maintain Canada's competitiveness.
Despite these risks, foreign investment is undoubtedly beneficial to the Canadian economy, as without it, only a fraction of the investment needed to improve Canada's economy will go forward, and Canada's challenges will only get bigger.
Potential macro implication: higher interest rates
An important consideration is the broader impact that such massive borrowing demand will have on the economy. To attract the capital needed will likely require higher interest rates or, in other words, higher returns on investment. Higher interest rates would incentivize households to save/repay debt, thereby pushing them into net saving. Similarly, higher interest rates/returns will be necessary to attract foreign capital.
However, a higher cost of capital will mean that some of the needed investment may no longer be economically viable. As a result, some required new housing units would not be built, further deteriorating affordability and/or slowing growth in the stock of capital per worker, resulting in continued erosion of Canada's competitiveness.
Hence, to avoid interest rates from increasing too much, measures to increase the domestic supply of capital will be required. This could take various forms, like attractive new investment vehicles, whether it is through lower taxation or simply appealing to savers' preferences.
Moreover, actions will also need to be taken to ensure that national savings are directed towards domestic investment rather than abroad. This could involve incentives or partnerships with large pension funds, asset managers, and other major Canadian investors to deploy more of their assets under management to fund local projects. Similar incentives should also be extended to households to encourage a greater share of their savings to be directed toward Canadian investments.
Similarly, as we have identified, there will also be a need to incentivize financial sectors to direct a greater share of their lending towards business lending rather than to household lending. This would increase business borrowing and investment and reduce the likelihood that households would crowd out the business sector.
Conclusion
Solving Canada's economic problems will not come cheap. Restoring housing affordability while closing even half the productivity gap with the top-performing OECD economies would require somewhere between $4.1 trillion and $5.4 trillion in investment over and above what is already likely to be spent over the next decade. Even the bare-minimum objective, which is simply preventing further deterioration in affordability and competitiveness, still carries a price tag of $1.1 trillion to $2.1 trillion in additional investment.
Investments of this size cannot be financed out of thin air. As we have shown, someone has to save for someone else to invest, and neither corporations nor government are in a position to be net lenders over the coming decade. That leaves non-residents and households to fill the gap. Foreign capital will almost certainly need to play a larger role than it does today, but leaning further on foreign ownership is not without cost: a growing share of the returns on Canadian investment would flow abroad rather than being reinvested domestically, with real risks of turning Canada into a more extractive economy and making it more sensitive to the preferences of foreign investors. At the same time, households need to shift from being significant net borrowers to something closer to net savers, a reversal that will demand significant belt-tightening at a moment when affordability pressures are already acute.
This will come at a cost to the broader economy. Raising the volume of savings required, whether from households or from abroad, will likely mean higher interest rates and a higher cost of capital, which in turn risks making some of the very investments Canada needs uneconomical to build. Avoiding that outcome will require deliberate policy choices: incentives to direct more domestic savings, including from pension funds and asset managers, into Canadian projects, and a financial system that channels more lending toward productive business investment rather than household borrowing.
What is clear is that there is no cheap or easy path out of Canada's current predicament. The country's ambitions for housing affordability and competitiveness are within reach, but only with a scale of investment, saving, and structural adjustment that Canada has not mustered in decades. Falling short of that ambition will mean accepting that the country will keep falling further behind.
Appendix
Fig 11. Productivity vs GDP per capita (% deviation relative to Canada)
Source: OECD, Servus Credit Union
Fig 12. Stock of capital per worker vs GDP per capita (% deviation relative to Canada)
Source: OECD, Servus Credit Union